Easy-to-read, easy-to-interpret PROFOX reports include all of the information you expect from the best oximetry software. All reports have wide left margins to accommodate chart-folds and use large character sizes so the reports can be easily read after being copied or sent via fax.
These reports are ideal for patient charts, Medicare, and other third-party records.
PROFOX lets you print the reports in color, can be sent by fax directly from the computer, and can be previewed on the computer screen. You can even condense the summary report to leave room at the bottom for typed dictation or physician's notes.
The reports satisfy the latest Medicare guidelines for both supplemental oxygen and BiPAP (the longest continuous time spent with saturation less than 89%)
The report headings (titles) can be easily changed and saved. Up to 30 different headings can be saved so you can report tests for other facilities.
Click on a report below to view and print a larger version. To download the reports to your computer to print in MS Word for Windows, click here.
••••••••••••••••••••••••••••••••••••••••••••••••••••••••••••••••••••••••••••••••••••••
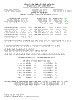
Comprehensive Report:
Summary, Saturation & Pulse Graphs
The comprehensive report graphs the entire test and also includes the most pertinent statistics. This provides an "easy to interpet" single page report.

••••••••••••••••••••••••••••••••••••••••••••••••••••••••••••••••••••••••••••••••••••••
Report 1:
8-Hour Saturation & Pulse Graphs
This report gives you a broad overview of saturation and pulse measurements in 8-hour blocks. Each block is conveniently presented on a separate page, allowing you to quickly perceive the oximetry pattern.

••••••••••••••••••••••••••••••••••••••••••••••••••••••••••••••••••••••••••••••••••••••
Report 2:
2-Hour Saturation & Pulse Graphs
This report is similar to the 8-hour version but provides a detailed look at 2-hour blocks of data. You can print the entire study in 2-hour segments, or you can print only the 2-hour period showing the lowest average saturation.

••••••••••••••••••••••••••••••••••••••••••••••••••••••••••••••••••••••••••••••••••••••
Report 3:
Graphic % Time at Each Saturation
This report is an excellent visual aid for patients because they can easily see the results. In this report, every integer from 40 to 100 is represented on both the top and bottom graphs on the page. Saturations lower than 40 are represented as 40. The time shown on the graphs is the total valid sampling time, which is defined as the recorded time minus deleted periods and periods of excluded sampling.

••••••••••••••••••••••••••••••••••••••••••••••••••••••••••••••••••••••••••••••••••••••
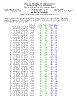
Report 4:
Text % Time at Each Saturation
This report is especially useful when you need to report the exact amount of time a patient spent at specific oxygen levels and pulse ranges.

••••••••••••••••••••••••••••••••••••••••••••••••••••••••••••••••••••••••••••••••••••••
Report 5:
Text Listing of Deepest Desaturations
This report presents information on the deepest saturation events, listing up to 40 events on one page. It identifies each saturation's onset, lowest point and pulse range. This report is very helpful when assessing the severity of apneic events and allows you to adjust the value that defines desaturation event onset. It is especially useful for specific guidelines such as Medicare BiPAP.
••••••••••••••••••••••••••••••••••••••••••••••••••••••••••••••••••••••••••••••••••••••
Report 6:
Text Scoring & Analysis Summary
This report is a one-page summary of the patient's vital oximeter data. PROFOX identifies the onset of a desaturation event when the saturation decreases by a predefined Event Definition Point (EDP) within a two-minute interval.